Who are the candidates
- Laravel 5, PHP 7.0, Nginx
- Lumen 5, PHP 7.0, Nginx
- Express JS 4, Node.js 8.1, PM2
- Django, Python 2.7, Gunicorn
- Spring 4, Java, Tomcat
- .NET Core, Kestrel
What are we testing
We are interested in the number of requests per seconds each framework achieves on different server configurations alongside how clean or verbose the code looks like.
How server configurations look
We are also interested in how each framework scales its performance and what is the price of achieving such performance. This is why we’ll test them on 3 different server configurations using DigitalOcean:
- 1 CPU, 512 MB - $5 / month
- 4 CPU, 8 GB - $80 / month
- 12 CPU, 32 GB - $320 / month
What are we building
We want to test a real life application example so we’ll basically build a Web REST API that exposes 4 endpoints, each one having a different complexity:
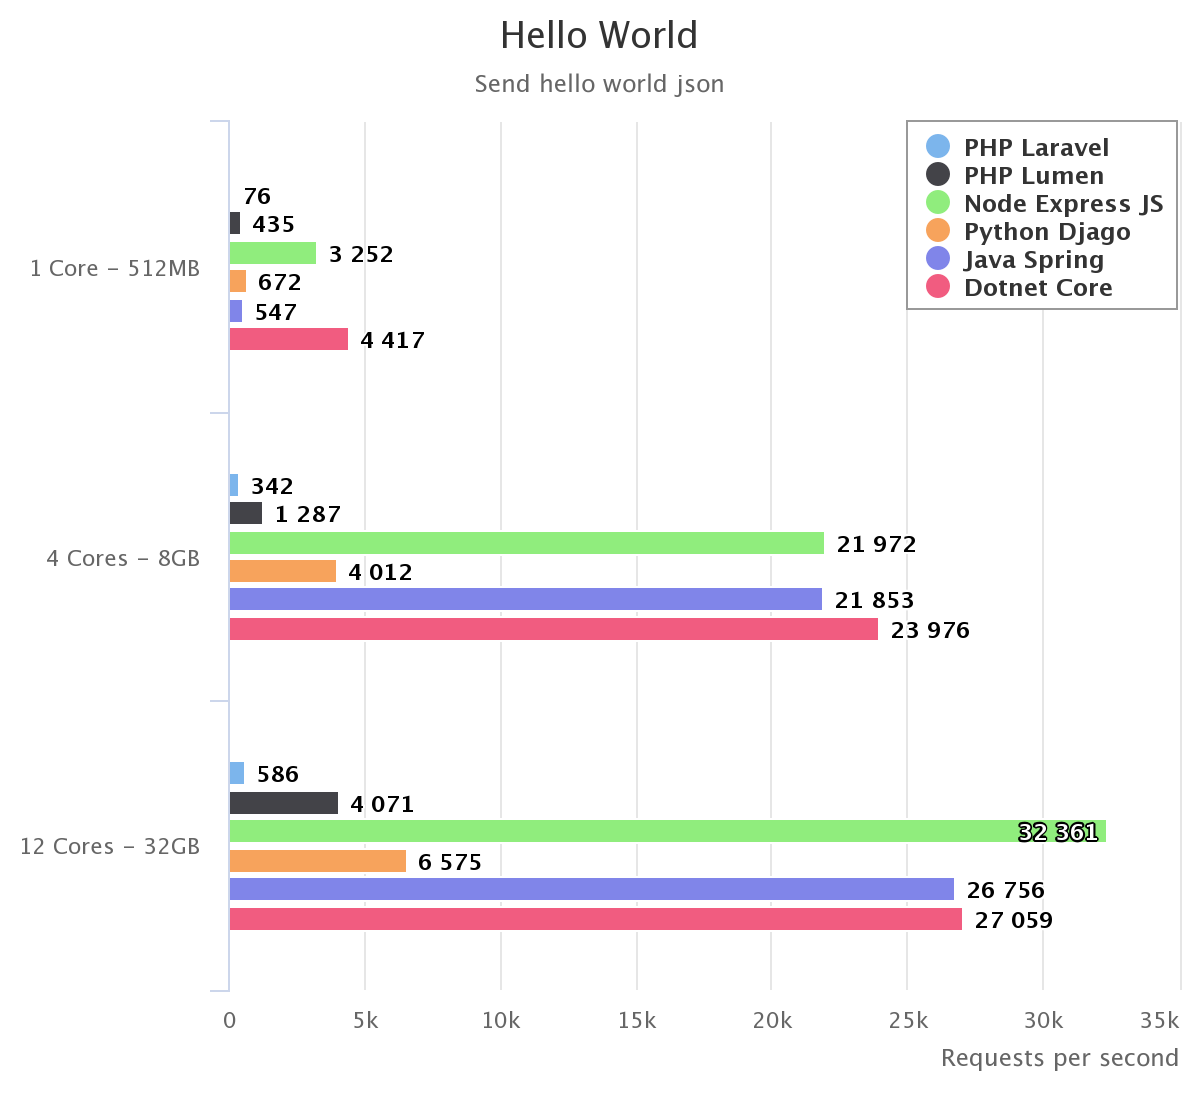
- Hello World - simply respond with a JSON containing Hello World string.
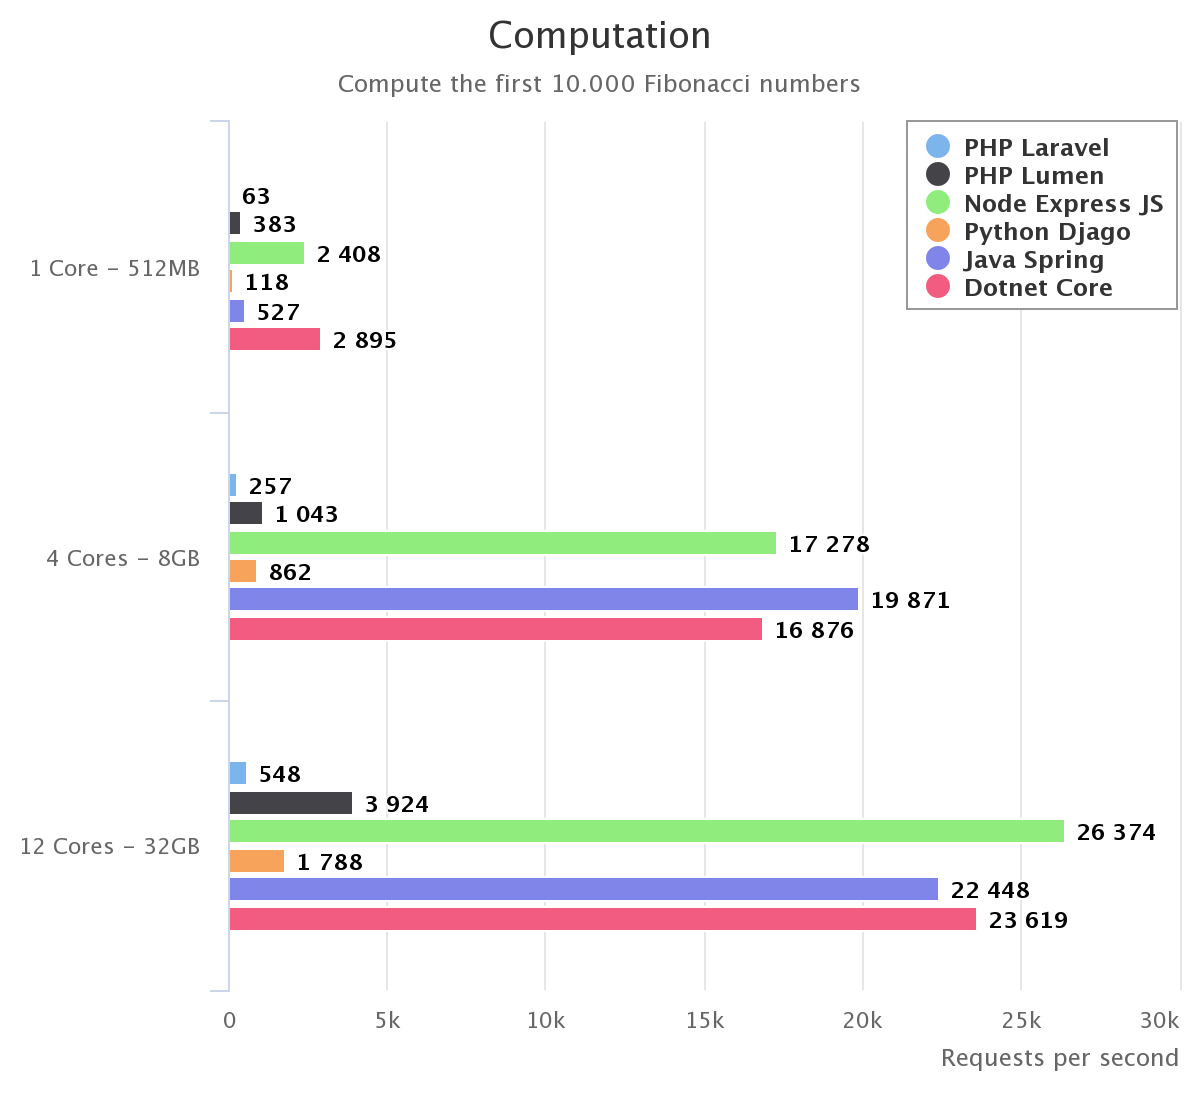
- Computation - compute the first 10.000 Fibonacci numbers.
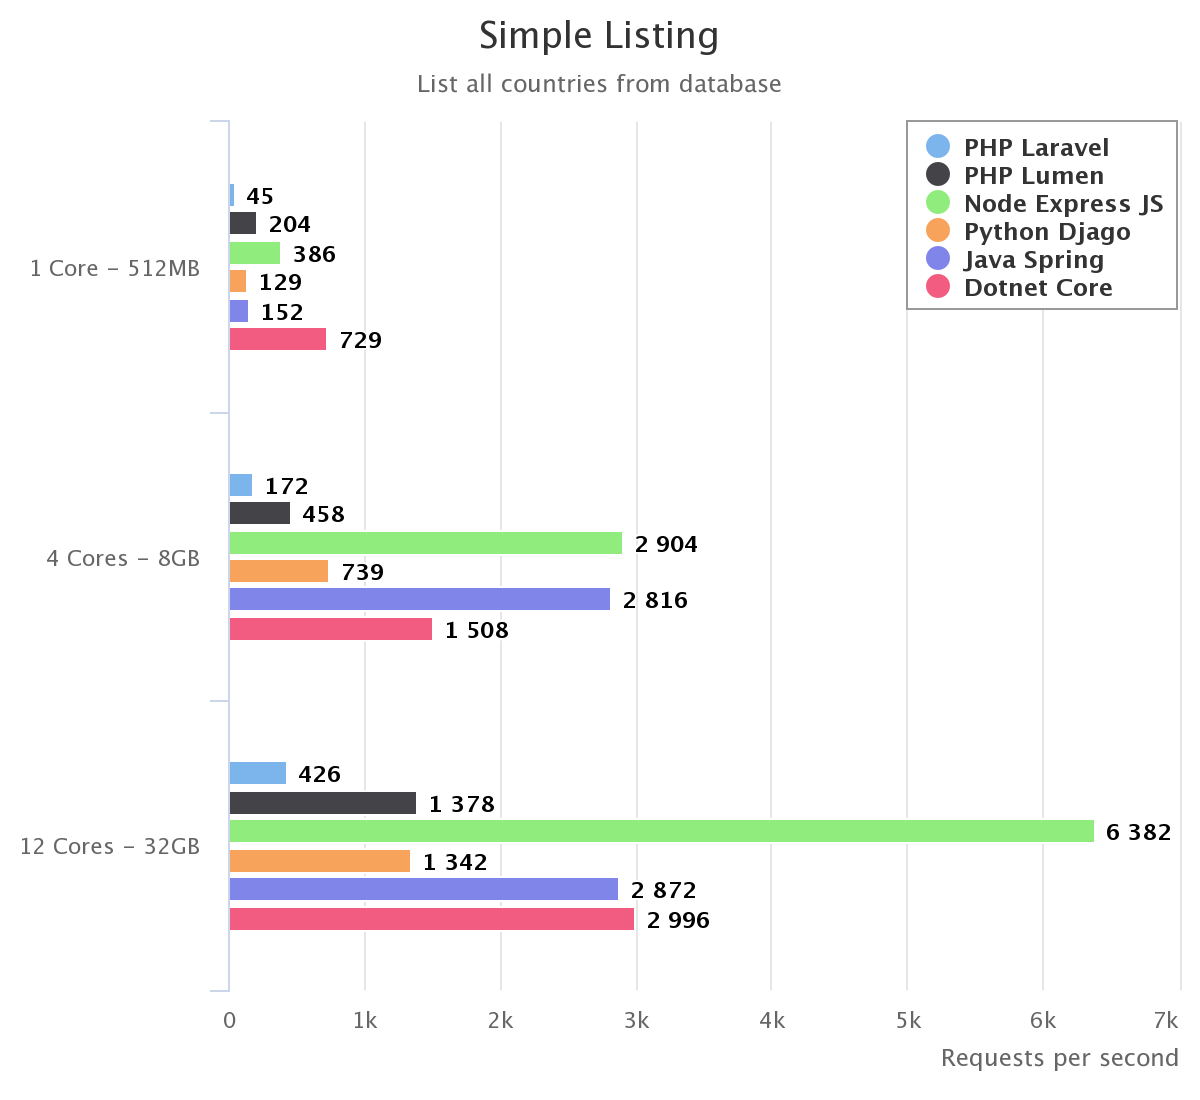
- Simple Listing - we have a MySQL database containing a countries table and we’ll list all the countries.
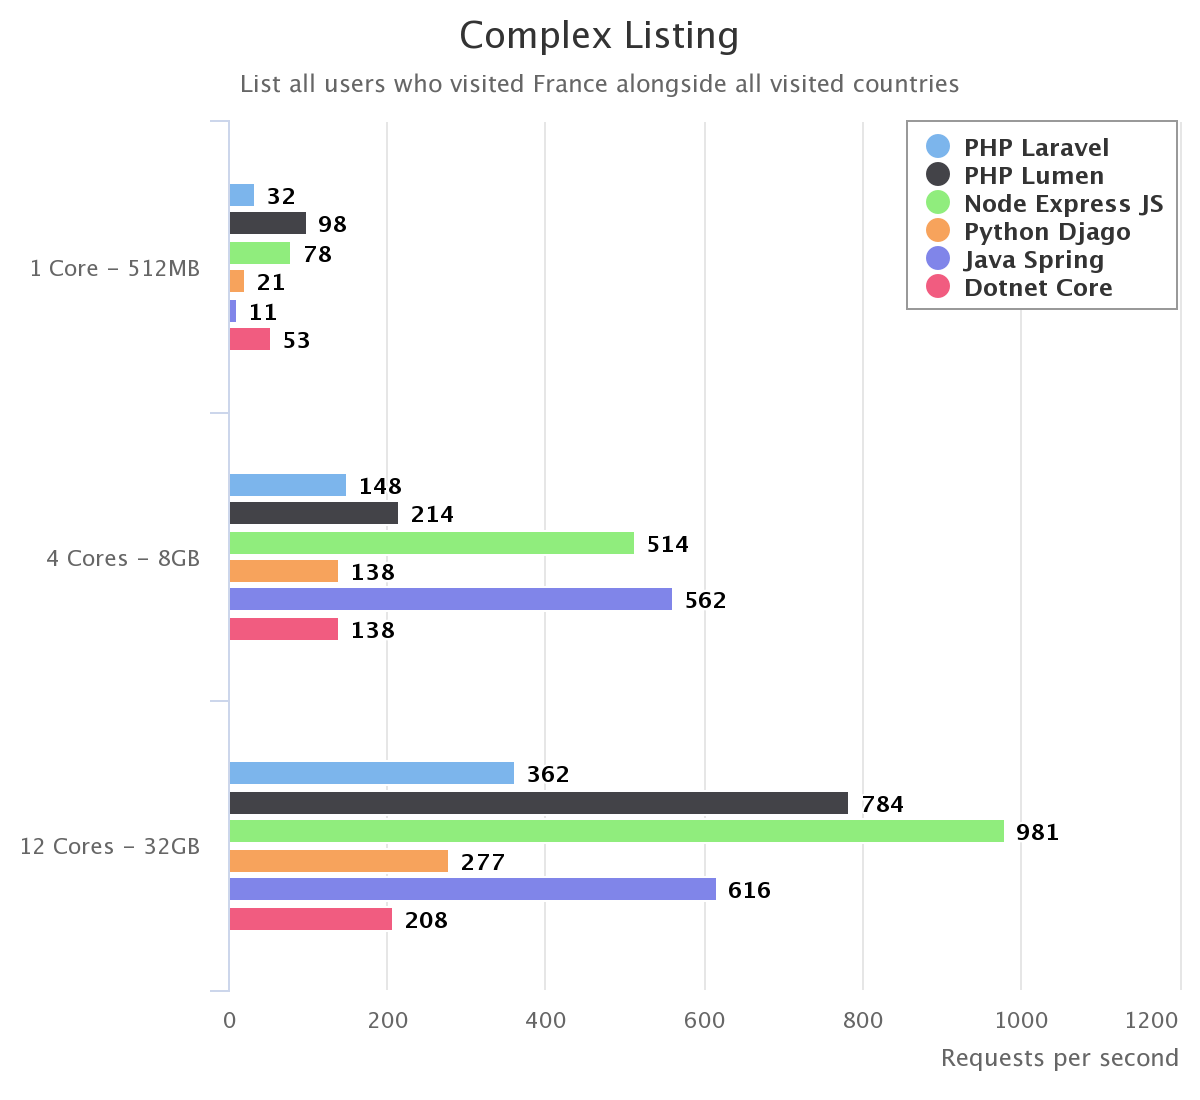
- Complex Listing - we add a users table alongside a many-to-many mapping between users and countries and we want to list all users that visited France, alongside all countries each one visited.
For building the last two endpoints we’ll use the tools each framework provides to achieve our goal in the easiest possible way.
How are we testing them
For testing them we’ll use both wrk and ab HTTP benchmarking tools in order to check if we get similar results and also variate the concurrency of the requests so each technology can achieve its maximum potential.
These tools will run on their own droplet created on DigitalOcean so they don’t compete on server resources with the actual API application.
Also, the server used for placing the test requests and the one used to run the application are linked using their private IP so there won’t be any noticeable network latency.
Benchmark results
Below you can see the results grouped by each endpoint and also you can check on a single chart how each framework scaled on different server configurations.


No comments:
Post a Comment